What a hosting business needs from its own platform
A hosting company or a web agency with maintenance contracts reaches a point where checklists and browser tabs stop working. There are dozens of shared servers, hundreds of WordPress sites and customers who expect to hear about a problem before they find it themselves. The work splits between people with different rights. Administrators run updates and change alert rules. The on-call engineer watches incidents at night and needs to see everything but change little. Customers want proof that their site is backed up and online, without a round of emails.
So the platform has to collect server metrics every minute, tie each site to its server and its customer, and turn thresholds into alerts that reach the right person. Updates must be safe to run in batches, with a backup before and a check after. The business also needs a customer-facing view and invoices it can stand behind.
How the Kaitsija demo works
Kaitsija is a fictional product that VirtueInfo created for this demo. It is not a client. Its servers, customers and .example domains are sample data, and no plugin, control panel or hosting brand is named. The demo is bilingual, with the Finnish screens at the root and English under its own path. It opens without signing in, and a role switch lets you act as administrator, on-call engineer or customer.
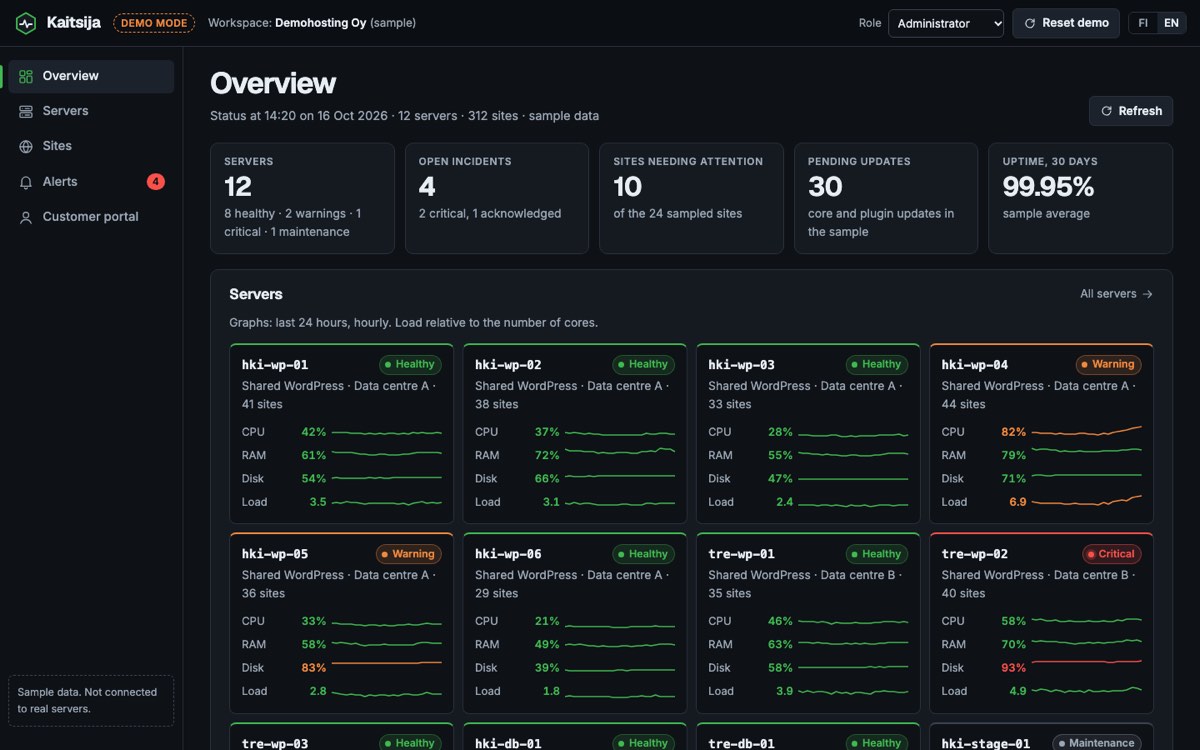
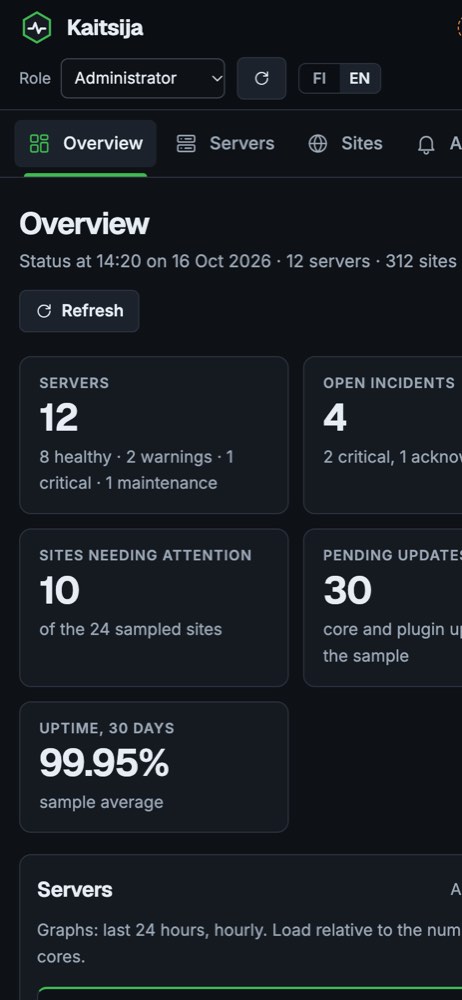
The overview shows key figures for servers, open incidents, sites needing attention, pending updates and 30-day uptime. Twelve server cards carry 24-hour sparklines for CPU, memory, disk and load, and a hexagon map shows the state of each site at a glance. The servers screen adds search, filters by status, role and data centre, and a detail drawer with hourly graphs and a sample process list.
The sites screen is the signature feature. It lists 24 sample sites with their core and plugin updates, PHP version, backup age, days of SSL validity and uptime. An administrator selects sites and starts a batch update, and a progress log shows each site being backed up, updated and health-checked. One sample site fails its check and is rolled back, which is the situation a hosting team worries about most. In the on-call role the update button is disabled and the screen says why.
The alerts screen holds today's incidents on a timeline, each with an acknowledge button and the rule that fired it. Below it sits a rule editor with validated fields for metric, threshold, duration and severity, quiet hours that collect night-time warnings into a morning summary, and placeholder channels for email, SMS and chat. The customer portal shows uptime bars, a backup list with a simulated restore, a manual backup button and sample invoices with the VAT calculation shown.
What a production build adds
The demo runs on sample data in the browser. A live platform starts with a small agent on each server that sends metrics outward over an encrypted connection to a time-series database. Older metrics are thinned out so storage stays sensible as the fleet grows. An alert engine evaluates the rules, removes duplicates, escalates unacknowledged incidents and sends messages through real email, SMS and chat services.
Site updates run through a command-line connection to each WordPress install. Backups are encrypted and stored away from the server they protect. Server credentials sit in a secrets store rather than in the database, and staff sign in with two-factor authentication. Each customer workspace is separated from the others at the data level. Every update, restore, acknowledgement and rule change goes into an audit log with the person and time. Billing data flows to your accounting system.
Market notes
Finland
Finnish hosting customers often ask where their data is kept, and many prefer Finland or the EU, so the portal can show the data centre for each site. Invoices carry the business ID and VAT at the general rate of 25.5%, and many business customers expect e-invoices. As the processor of customer data, the host needs data processing agreements under the GDPR, and the platform's logs help answer customer audits. Larger hosting and managed service providers may fall under the NIS2 cybersecurity rules, which Traficom supervises in Finland, and incident records and access control support that work. The interface should run in Finnish and English, with Swedish where customers need it.
India
Invoices need GST details, and small agencies often pay by UPI. Alerts on WhatsApp are welcome alongside email.
USA
Larger customers may ask for security documentation before signing. Sales tax on hosted services differs between states.
Canada
Some customers ask for data hosted in Canada. Québec customers expect French in the portal and on invoices.
Australia
Invoices are tax invoices showing the ABN and GST. Customers often want their sites in Australian data centres.
How we run a project like this
We start with discovery: your fleet, your current tools, the incidents that cost you most and what customers ask for. Then we agree on phases. A first release often covers monitoring, alerts and the sites table, with batch updates, the customer portal and billing following. A dedicated team of a project manager, a designer, developers, a DevOps engineer and a tester builds it with you, and the infrastructure side belongs to our cloud solutions service.
After launch we keep the platform running, patch it and add features as your fleet changes. Tell us how many servers and sites you manage and which tools you use today through our contact page, and we will reply with a proposal and a quote.